

by Brightmine
Despite greater transparency, the underlying factors shaping gender pay inequity remain deeply embedded.
What does the 2024 data tell us about gender pay inequity? How does my organisation compare with the industry average?
The deadline for gender pay gap reporting has now passed and more than 10,000 organisations have shared information on their gender pay and bonus gaps. We report on the headline data and unearth some of the trends.
About the report:
10,728
sample organisations
Analysis based on all organisations that has submitted data by 9am on Monday 7 April 2025
All UK organisations with 250 or more employees must report six gender pay gap measures. This Brightmine Pay Equity Analytics analysis is based on all organisations that had submitted data by 9am on Monday 7 April 2025, resulting in a sample of 10,728 organisations (including 436 with fewer than 250 employees).
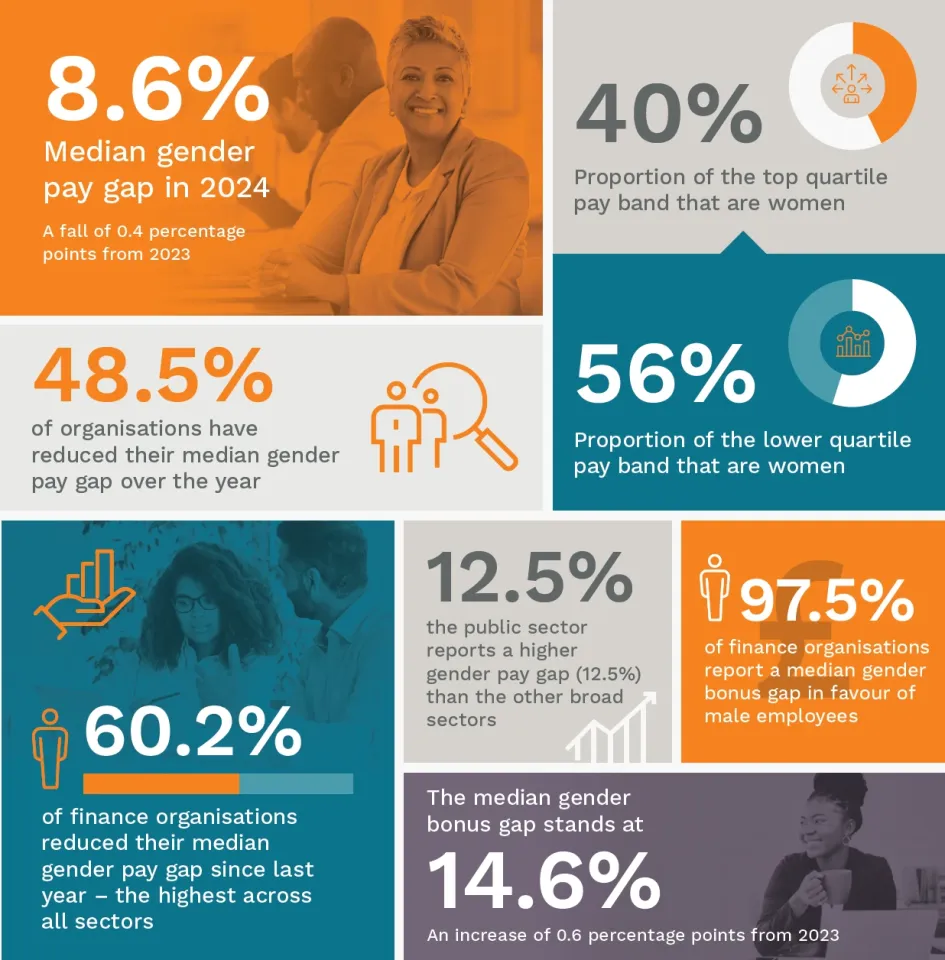
Based on this full sample, the median gender pay gap was 8.6% in 2024, the eighth reporting year showing a gap in favour of men. Compared with all organisations that have now submitted for 2023, the median gender pay gap has fallen just 0.4 percentage points, from 9.0% (revised). We look below at matched sample trends to assess progress among organisations that submitted data for both years.
The headline median gender bonus gap stands at 14.6%, although this marks an increase from 2023, of 0.6 percentage points. The proportion of male and female employees receiving a bonus remains almost on a par (25% and 24% respectively). In total, 2,565 organisations reported not paying any male employees a bonus, with 2,580 the equivalent for organisations where no female employees received a bonus.
Based on this full sample, the median gender pay gap was 8.6% in 2024, the eighth reporting year showing a gap in favour of men.
Gender pay gap: Key findings from the latest reported data
Almost half of organisations report a reduced pay gap
Progress on the gender pay gap based on the full sample of reporting organisations does not take into account how individual organisations have progressed since the year before. However, a matched sample analysis is possible, as 10,112 of the organisations that submitted data for 2024 also submitted for 2023. Tracking progress among this group, we find that 48.5% reduced their median gender pay gap over the year to 5 April 2024.
48.5%
of organisations have reduced their median gender pay gap over the year
49.1%
Report a bonus gap in favour of male employees
The greatest progress is recorded for organisations in the finance sector, where 60.2% have reported a lower median gender pay gap than in 2023. Just behind sits the chemicals, oil and pharmaceuticals sector, where 59.5% of organisations reduced their median gender pay gap.
When it comes to the gender bonus gap, a less robust picture emerges as just 31.7% of organisations report a reduction in the median bonus gap since the previous year. The sector with the largest median gender bonus gap – the finance sector, reporting a 35.9% bonus gap – has recorded the greatest progress in reducing this, with 47.2% of sector organisations in the matched sample reporting a reduction.
A pay gap in favour of men continues to be the norm
77.9%
Median gender pay gap in favour of men
49.1%
Report a bonus gap in favour of male employees
There is little change in the proportion of organisations reporting a median gender pay gap in favour of men – standing at 77.9% in the 2024 reporting, only very slightly changed from the (revised) 78% for 2023.
The gender bonus gap stands slightly different, with fewer organisations (49.1%) reporting a bonus gap in favour of males. However, these figures are in some way distorted by the lack of bonus payments in many public and not-for-profit sector organisations. In manufacturing and production, 56.2% of organisations report a bonus gap in favour of male employees, rising to 62.8% in private-sector services.
Even more stark are the findings by industry sector. Here, for example 91.5% of finance sector organisations report a median gender bonus gap in favour of male employees, despite roughly the same proportion of male and female employees receiving a bonus (88.2% and 87.4% respectively).
Top pay quartile dominated by male employees
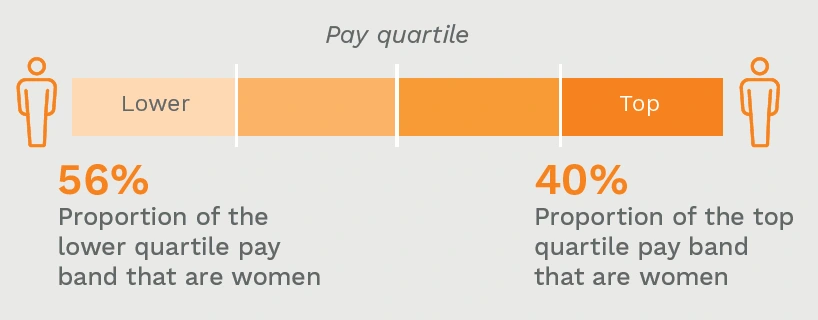
In recognition of the importance of where men and women sit within the pay hierarchy to gender pay gap outcomes, organisations must report the proportion of male and female employees in the lower, lower middle, upper middle and top quartile pay bands. Overall, female employees continue to be overrepresented in the lower pay quartiles and underrepresented in the top pay quartile.
In 2024, organisations reported a median 56% of the employees in the lower pay quartile being female, compared with only 40% of employees in the top pay quartile.
These overall figures do, however, mask some stark differences by industry sector. For example, in charities/not for profit, a median 73% of employees in the lower pay quartile are women, while in public services this rises to 76%. In private-sector services there is a more even split, with 53.3% of employees in the lower pay quartile
being female and 46.7% male.
Highest pay gaps reported among public services organisations
Perhaps the most interesting findings from the data are those by broad economic sector. Overall, the public sector is more likely than any other to report a median gender pay gap in favour of men, as reported by 84% of organisations. Around half
(51.1%) of public-sector organisations in our matched sample analysis have reported a lower median gender pay gap than for 2023.
Many public-sector organisations have defined pay bands, therefore we might assume that their gender pay gaps would be lower. However, this is likely to be a perfect example of the importance of understanding the data behind the headlines,
especially workforce composition data, as where women sit in the job structure is likely to be playing a significant part in the public-sector data. As noted above, in the public sector 76% of the employees in the lower pay quartile are female.
Gender pay gap reporting, by industry, 2024
Exploring the data further, we see some distinct differences between industries, as shown below.
| Industry sector | Median gender pay gap | Median gender bonus gap | Organisations reporting a median GPG in favour of males | Organisations reporting a reduction in the median GPG since the previous year* | Organisations reporting reduction in the median gender bonus gap since the previous year* |
|---|---|---|---|---|---|
| Agriculture and forestry | 2.7% | 9.6% | 61.2% | 59.2% | 38.8% |
| Central government | 7.4% | 0% | 78.0% | 52.4% | 23.2% |
| Chemicals, oil and pharmaceuticals | 6.1% | 5.0% | 78.6% | 59.5% | 50.0% |
| Facilities, security and support services | 0.3% | 0% | 53.5% | 41.4% | 33.2% |
| Construction | 22.7% | 25.0% | 93.6% | 51.1% | 41.4% |
| Electricity, gas and water | 10.5% | 11.5% | 83.7% | 50.0% | 43.2% |
| Engineering and metals | 10.3% | 6.9% | 82.8% | 53.2% | 44.2% |
| Finance | 21.0% | 35.9% | 97.5% | 60.2% | 47.2% |
| Food, drink and tobacco | 3.8% | 0.2% | 74.3% | 55.6% | 38.0% |
| Hotels, catering and leisure | 0.9% | 15.4% | 56.5% | 46.3% | 37.8% |
| Information and communication | 14.9% | 22.8% | 92.3% | 53.7% | 49.9% |
| Local government | 1.5% | 0% | 56.3% | 59.3% | 9.3% |
| General manufacturing | 8.0% | 8.1% | 79.0% | 54.9% | 42.3% |
| Not for profit | 1.8% | 0% | 60.5% | 46.5% | 15.8% |
| Paper and printing | 10.7% | 10.3% | 93.6% | 51.1% | 31.9% |
| Professional and business services | 10.8% | 20.6% | 78.8% | 51.4% | 39.0% |
| Public education | 19.9% | 2.8% | 92.1% | 46.4% | 8.3% |
| Public health | 5.8% | 0% | 78.6% | 58.5% | 23.7% |
| Public safety | 11.3% | 0% | 82.8% | 58.6% | 26.3% |
| Retail and wholesale | 5.0% | 18.2% | 73.8% | 50.3% | 45.0% |
| Transport and storage | 6.3% | 4.2% | 81.8% | 57.1% | 39.9% |
Source: Brightmine Pay Equity Analytics analysis of government data.
How Brightmine can help
Pay Equity Analytics – part of the Brightmine portfolio – offers HR and reward professionals advanced pay equity solutions to provide actionable insights on existing pay gaps.
Advanced statistical analysis identifies variables for employee demographics such as gender, ethnicity, sexual orientation and disability, identifying the causes of pay gaps, and proposing and tracking remedial actions.
Brightmine Pay Equity Analytics also offers a gender pay gap reporting services to guide users through the process of data collection and metric calculation to meet current UK gender pay gap reporting requirements.
You may also be interested in…
About the author

Brightmine
With more than 10,000 customers, Brightmine is a leading global provider of people data, analytics and insight – empowering HR leaders to deliver brighter business outcomes.
For more than two decades, Brightmine, formerly XpertHR, has continued to help HR leaders confidently navigate the evolving world of work through our unique combination of critical workforce data, AI-enabled technology and trusted HR expertise.
Brightmine is a division of LexisNexis Data Services within RELX®, a global provider of information-based analytics and decision tools. RELX serves customers in 180+ countries with 35,000+ employees. Ticker: London: REL; Amsterdam: REN; New York: RELX.
Follow Brightmine on LinkedIn
Sign up to receive expert HR insights from Brightmine
Join our community and stay updated with industry trends, expert insights, valuable resources, webinar invites… and much more.
Sign up now and receive regular updates straight to your inbox!